
 PETROLEUM QUALITY INSTITUTE OF AMERICA The Data Speak for Itself... Home About Us Methodology Contact Us |
|||||||||||
|
|
Click Bottles Below for
Data and Assessments |
||||||||||
TEST RESULTS BY VISCOSITY GRADE |
|||||||||||
0W-20 |
5W-20 |
5W-30 |
5W-40 |
||||||||
|
Test Results for Passenger Car Motor Oils
CLICK BOTTLES FOR DETAILS |
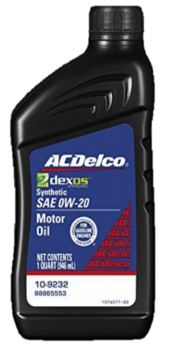 |
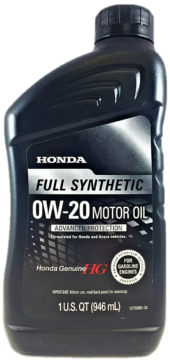 |
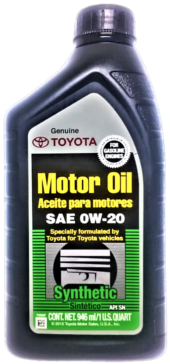 |
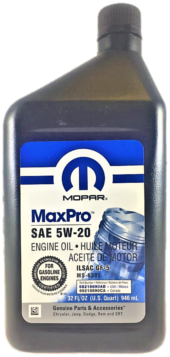 |
 |
 |
 |
||||
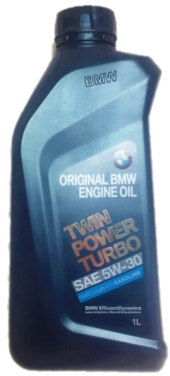
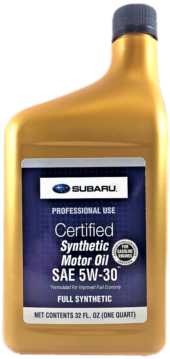
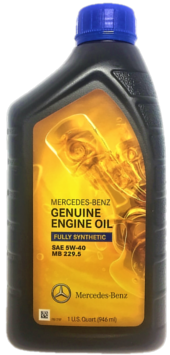
| ACDelco | Honda | Toyota | Mopar | BMW | Subaru | Mercedes-Benz | |||||
| API SN | API SN ILSAC GF-5 |
API SN | API SN ILSAC GF-5 |
ACEA A3/B4, API SL, BMW Longlife-01 |
API SN | MB 229.5 | |||||
| PHYSICAL TESTS (click test for details) | Standards(a) |
||||||||||
| TBN, mg KOH/g,(ASTM D2896) | 8.05 | 8.09 | 10.28 | 8.62 | 11.05 | 8.70 | 8.22 | ||||
| Viscosity @ 100ºC, cSt, ASTM D445) for an SAE XW-20 | 6.9 to <9.3 | 8.51 | 8.88 | 8.36 | 8.77 | - | - | - | |||
| Viscosity @ 100ºC, cSt, ASTM D445) for an SAE XW-30 | 9.3 to <12.5 | - | - | - | - | 11.96 | 10.4 | - | |||
| Viscosity @ 100ºC, cSt, ASTM D445) for an SAE XW-40 | 12.5 to <16.3 | - | - | - | - | - | - | 13.52 | |||
| Viscosity @ 40ºC, cSt, (ASTM D445) | 44.59 | 46.70 | 35.18 | 51.75 | 73.08 | 56.26 | 82.95 | ||||
| Viscosity Index (ASTM D2270) | 171 | 174 | 227 | 148 | 160 | 177 | 166 | ||||
| Viscosity @ -35ºC mPa s (cP) (ASTM D5293) for an SAE 0W-XX | 6,200 Max | 5,642 | 5,342 | 4,102 | - | - | - | - | |||
| Viscosity @ -30ºC mPa s (cP) (ASTM D5293) for an SAE 5W-XX | 6,600 Max | - | - | - | 5,651 | 6,607 -f | 3,389 | 6,612 -f | |||
| NOACK Volatility, mass % loss, 1 hr, @ 250ºC (ASTM D5800) | 15 Max (d) | 12.0 | 12.8 | 12.9 | 12.5 | 6.2 | 10.1 | 8.3 | |||
| ELEMENTAL ANALYSIS-b,c | |||||||||||
| Additives | |||||||||||
| Calcium, ppm | 2,158 | 2,443 | 1,470 | 2,355 | 2,690 | 2,362 | 1,884 | ||||
| Magnesium, ppm | 9 | 12 | 674 | 5 | 18 | 6 | 11 | ||||
| Phosphorus, ppm | 600 to 800 | 743 | 744 | 750 | 714 | 938 -e | 705 | 801 | |||
| Zinc, ppm | 824 | 791 | 876 | 826 | 1,068 | 807 | 924 | ||||
| Molybdenum, ppm | 81 | 16 | 787 | 178 | 54 | 179 | <1 | ||||
| Barium, ppm | <1 | <1 | <1 | <1 | <1 | <1 | <1 | ||||
| Boron, ppm | 247 | 192 | 197 | 109 | 76 | 103 | 78 | ||||
| Silicon, ppm | 3 | 3 | 12 | 4 | 7 | 4 | 7 | ||||
| Potassium, ppm | <5 | <5 | <5 | <5 | <5 | <5 | <5 | ||||
| Manganese, ppm | <1 | <1 | <1 | <1 | <1 | <1 | <1 | ||||
| Titanium, ppm | <1 | <1 | <1 | <1 | <1 | <1 | <1 | ||||
| Copper, ppm | <1 | <1 | <1 | <1 | <1 | <1 | <1 | ||||
| Sodium, ppm | 7 | <5 | 6 | <5 | 5 | <5 | 6 | ||||
| Vanadium, ppm | <1 | <1 | <1 | <1 | <1 | <1 | <1 | ||||
| Contaminants | |||||||||||
| Silver, ppm | <1 | <1 | <1 | <1 | <1 | <1 | <1 | ||||
| Aluminum, ppm | <1 | <1 | <1 | <1 | <1 | <1 | <1 | ||||
| Chromium, ppm | <1 | <1 | <1 | <1 | <1 | <1 | <1 | ||||
| Iron, ppm | <1 | <1 | 1 | <1 | 1 | <1 | <1 | ||||
| Nickel, ppm | <1 | <1 | <1 | <1 | <1 | <1 | <1 | ||||
| Lead, ppm | <1 | <1 | <1 | <1 | <1 | <1 | <1 | ||||
| Antimony, ppm | <1 | <1 | <1 | <1 | <1 | <1 | <1 | ||||
| Tin, ppm | <1 | <1 | <1 | <1 | <1 | <1 | <1 | ||||
|
a- Standards, shown in yellow, are established by API, SAE and others. b- Test Method used for metal analysis is ASTM ASTM D5185. c- ASTM D5185-09 Reproducibility by Element. d- The specification is expressed to two significant figures, therefore results up to 15.5 are considered on specification. e- The specification for phosphorus in an API SL motor oil is 1,049 ppm. f- The results are within the API Expanded Range for Cold Crank Viscosity.
Copyright © 2018 Petroleum Quality Institute of America, LLC. |
|||||||||||