PETROLEUM QUALITY INSTITUTE OF AMERICA The Data Speak for Itself... Home About Us Methodology Contact Us |
|||||||
|
Consolidated 2017 SAE 0W-20 |
Click Bottles Below for
Data and Assessments |
||||||
SAE 0W-20 TEST RESULTS ACTIVE API SERVICE CATEGORIES |
|||||||
|
Test Results for Passenger Car Motor Oils
CLICK BOTTLES FOR DETAILS |
 |
 |
 |
 |
 |
 |
|
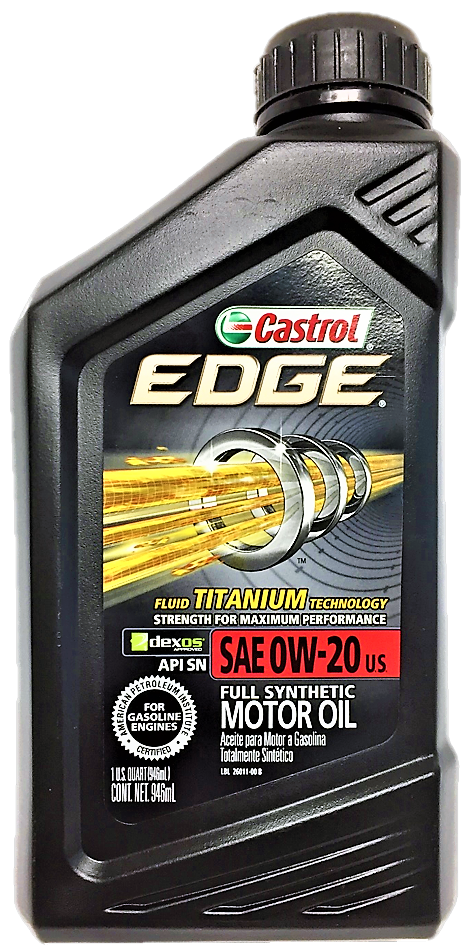
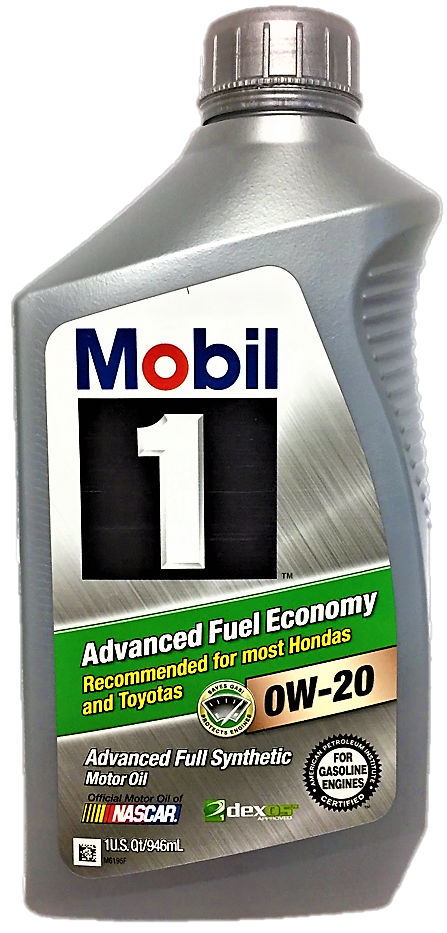
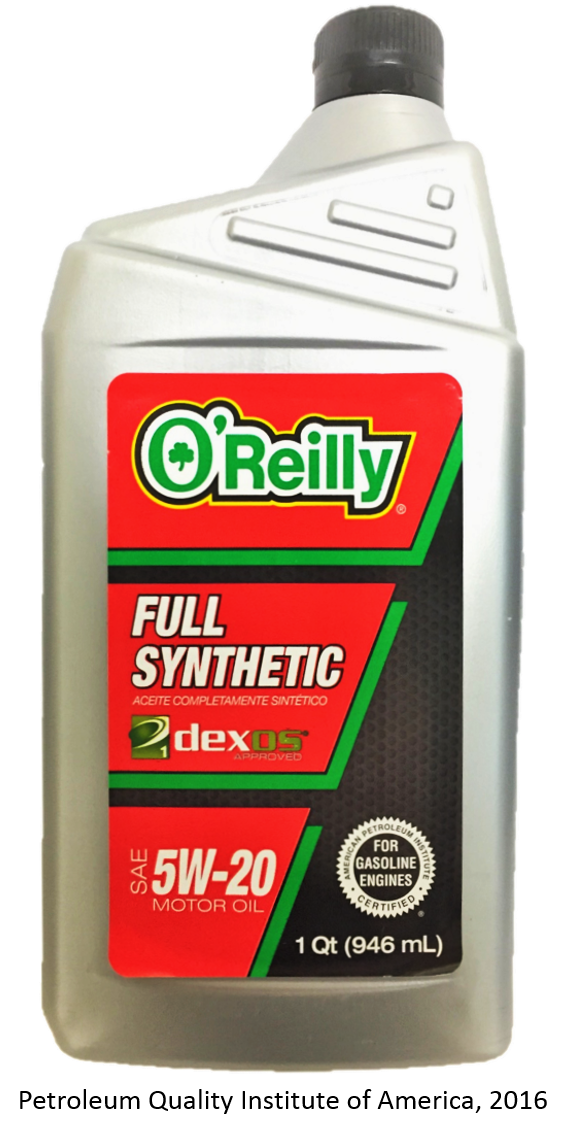
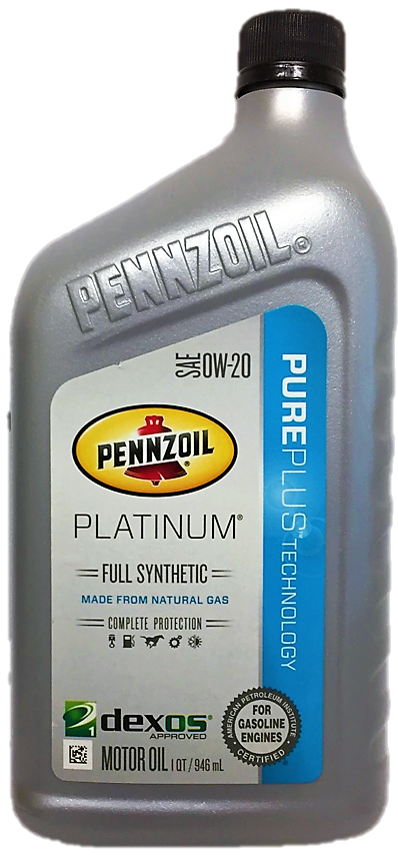
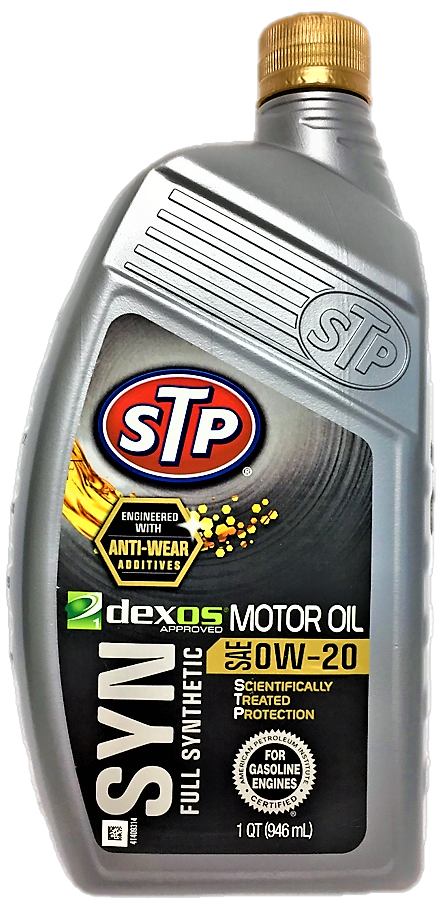
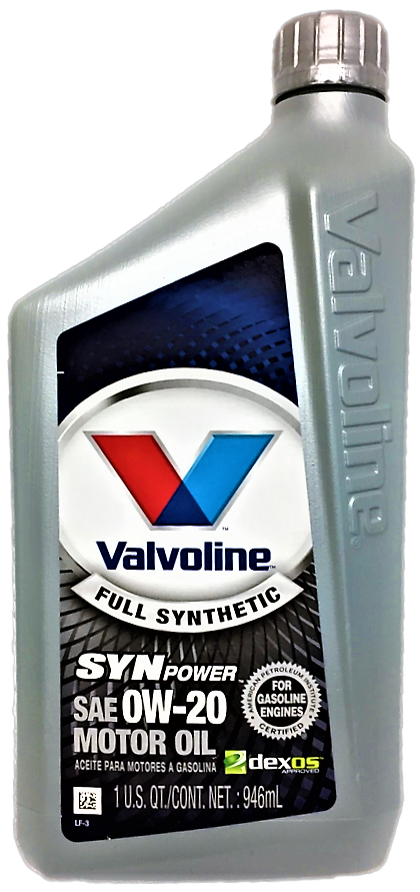
| Brand | Castrol Edge | Mobil 1 Advanced Fuel Economy | O'Reilly | Pennzoil Platinum | STP SYN | Valvoline | |
| Listed American Petroleum Institute (API) Service Category | API SN ILSAC GF-5 |
API SN ILSAC GF-5 |
API SN ILSAC GF-5 |
API SN ILSAC GF-5 |
API SN ILSAC GF-5 |
API SN ILSAC GF-5 |
|
| PHYSICAL TESTS (click test for details) | Standards(a) |
||||||
| TBN, mg KOH/g,(ASTM D2896) | 8.52 | 9.53 | 8.55 | 8.95 | 8.02 | 8.88 | |
| Viscosity @ 100ºC, cSt, ASTM D445) for an SAE 0W-20 | 6.9 to <9.3 | 8.52 | 8.80 | 8.26 | 8.33 | 8.28 | 8.39 |
| Viscosity @ 40ºC, cSt, (ASTM D445) | 45.25 | 45.97 | 43.45 | 44.28 | 43.35 | 44.48 | |
| Viscosity Index (ASTM D2270) | 168 | 174 | 168 | 166 | 170 | 168 | |
| Viscosity @ -35ºC mPa s (cP) (ASTM D5293) | 6,200 Max | 5,851 | 4,182 | 5,996 | 5,884 | 6,138 | 5,819 |
| NOACK Volatility, mass % loss, 1 hr, @ 250ºC (ASTM D5800) | 15 Max (d) | 12.8 | 10.7 | 11.8 | 10.3 | 13.1 | 11.6 |
| ELEMENTAL ANALYSIS-b,c | |||||||
| Additives | |||||||
| Calcium, ppm | 2,171 | 1,120 | 2,104 | 2,538 | 2,186 | 2,125 | |
| Magnesium, ppm | 8 | 789 | 9 | 10 | 11 | 9 | |
| Phosphorus, ppm | 600 to 800 (e) | 783 | 709 | 793 | 765 | 777 | 781 |
| Zinc, ppm | 815 | 730 | 815 | 812 | 808 | 817 | |
| Molybdenum, ppm | 81 | 88 | <1 | 56 | 83 | <1 | |
| Barium, ppm | <1 | <1 | <1 | <1 | <1 | <1 | |
| Boron, ppm | 389 | 102 | 1 | <1 | 232 | 1 | |
| Silicon, ppm | 4 | 6 | 5 | 5 | 4 | 5 | |
| Potassium, ppm | <5 | <5 | <5 | <5 | <5 | <5 | |
| Manganese, ppm | <1 | <1 | <1 | <1 | <1 | <1 | |
| Titanium, ppm | 8 | <1 | <1 | <1 | <1 | <1 | |
| Copper, ppm | <1 | <1 | <1 | <1 | <1 | <1 | |
| Sodium, ppm | <5 | <5 | 473 | <5 | <5 | 453 | |
| Vanadium, ppm | <1 | <1 | <1 | <1 | <1 | <1 | |
| Contaminants | |||||||
| Silver, ppm | <1 | <1 | <1 | <1 | <1 | <1 | |
| Aluminum, ppm | 3 | 2 | <1 | 1 | 1 | <1 | |
| Chromium, ppm | <1 | <1 | <1 | <1 | <1 | <1 | |
| Iron, ppm | 1 | <1 | 1 | <1 | <1 | 1 | |
| Nickel, ppm | <1 | <1 | <1 | <1 | <1 | <1 | |
| Lead, ppm | <1 | <1 | <1 | <1 | <1 | <1 | |
| Antimony, ppm | <1 | <1 | <1 | <1 | <1 | <1 | |
| Tin, ppm | <1 | <1 | <1 | <1 | <1 | <1 | |
|
a- Standards, shown in yellow, are established by API, SAE and others. b-Test Method used for metal analysis is ASTM ASTM D5185. c- ASTM D5185-09 Reproducibility by Element. d- This specification is expressed to two significant figures, therefore results up to 15.5 are considered on specification for 0W-20s. e- This specification is expressed to one significant figure, therefore results between 550 and 849 are considered on specification.
Copyright © 2018 Petroleum Quality Institute of America, LLC. |
|||||||